MARIA DOYLE OF COMPASS
ADDRESS
216 E LANCASTER AVE
WAYNE PA 19087
OFFICE ADDRESS
201 34TH ST
OCEAN CITY NJ 08226
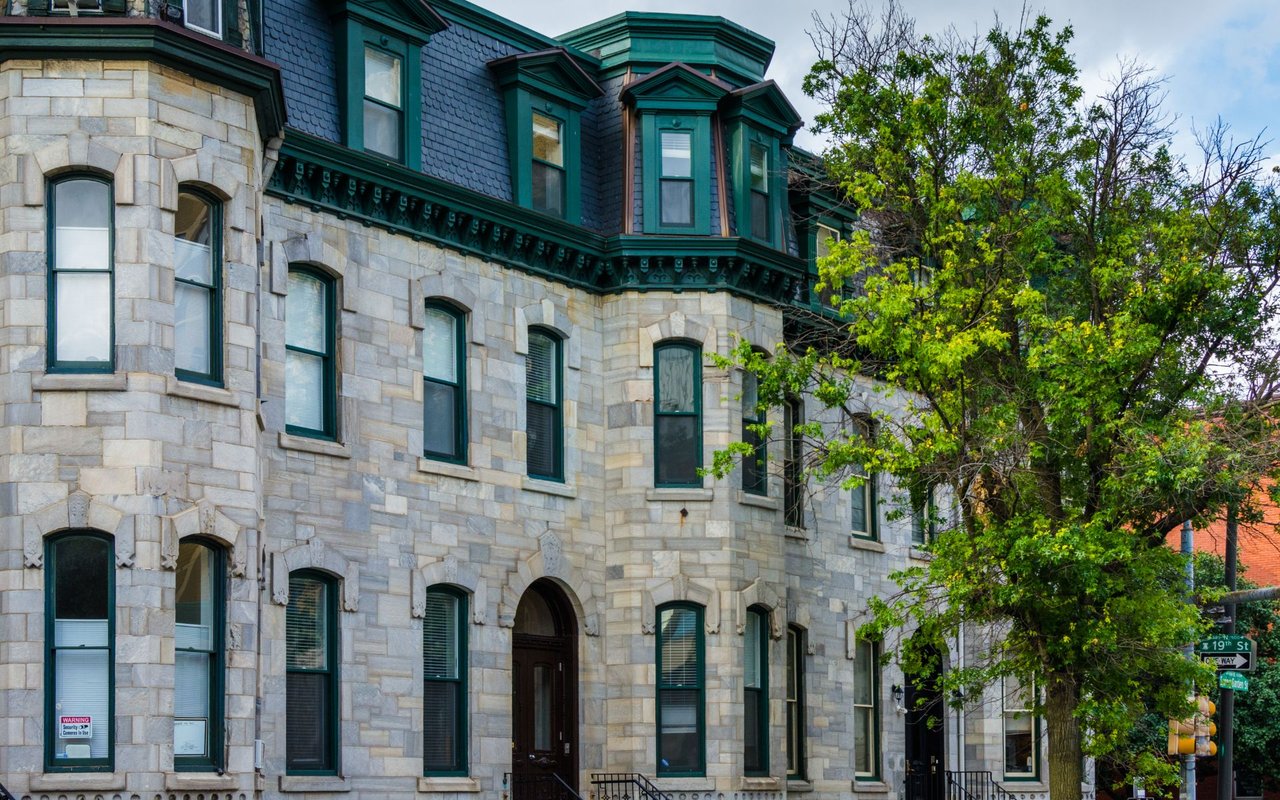
Wallingford and Swarthmore, both located in Delaware County, Pennsylvania, are charming suburban communities known for their strong sense of community, excellent schools, and proximity to Philadelphia. Wallingford, a census-designated place within Nether Providence Township, offers a mix of historic charm and modern amenities, while Swarthmore, a borough, is renowned for Swarthmore College and its vibrant town center.
12,835 people live in Wallingford / Swarthmore, where the median age is 41.8 and the average individual income is $65,383. Data provided by the U.S. Census Bureau.
Total Population
Median Age
Population Density
Average individual Income
There's plenty to do around Wallingford / Swarthmore, including shopping, dining, nightlife, parks, and more. Data provided by Walk Score and Yelp.
Explore popular things to do in the area, including Elixr Coffee & Roastery, Three Potato Four, and Pastry Pants.
| Name | Category | Distance | Reviews |
Ratings by
Yelp
|
|---|---|---|---|---|
| Dining | 3.69 miles | 5 reviews | 5/5 stars | |
| Dining · $$$ | 2.14 miles | 15 reviews | 4.9/5 stars | |
| Dining | 1.32 miles | 22 reviews | 4.5/5 stars | |
| Dining · $$ | 1.59 miles | 3 reviews | 5/5 stars | |
| Shopping | 2.14 miles | 3 reviews | 5/5 stars | |
| Active | 1.27 miles | 5 reviews | 4.6/5 stars | |
| Beauty | 1.87 miles | 7 reviews | 5/5 stars | |
| Beauty | 2.82 miles | 6 reviews | 4.8/5 stars | |
| Beauty | 3.72 miles | 4 reviews | 5/5 stars | |
| Beauty | 2.63 miles | 48 reviews | 4.6/5 stars | |
| Beauty | 4.83 miles | 3 reviews | 5/5 stars | |
|
|
||||
|
|
||||
|
|
||||
|
|
||||
|
|
||||
|
|
Wallingford / Swarthmore has 4,445 households, with an average household size of 2.79. Data provided by the U.S. Census Bureau. Here’s what the people living in Wallingford / Swarthmore do for work — and how long it takes them to get there. Data provided by the U.S. Census Bureau. 12,835 people call Wallingford / Swarthmore home. The population density is 3,206 and the largest age group is Data provided by the U.S. Census Bureau.
Total Population
Population Density Population Density This is the number of people per square mile in a neighborhood.
Median Age
Men vs Women
Population by Age Group
0-9 Years
10-17 Years
18-24 Years
25-64 Years
65-74 Years
75+ Years
Education Level
Total Households
Average Household Size
Average individual Income
Households with Children
With Children:
Without Children:
Blue vs White Collar Workers
Blue Collar:
White Collar:
Explore Other Neighborhoods
MARIA DOYLE TEAM
O: (610) 947-0408
M: (610) 348-2891
[email protected]
PA OFFICE ADDRESS
216 E LANCASTER AVE
WAYNE PA 19087
NJ OFFICE ADDRESS
201 34TH ST
OCEAN CITY NJ 08226
MARIA DOYLE TEAM
O: (610) 947-0408
M: (610) 348-2891
[email protected]
PA OFFICE ADDRESS
216 E LANCASTER AVE
WAYNE PA 19087
NJ OFFICE ADDRESS
201 34TH ST
OCEAN CITY NJ 08226